|
writing ของผมครับ
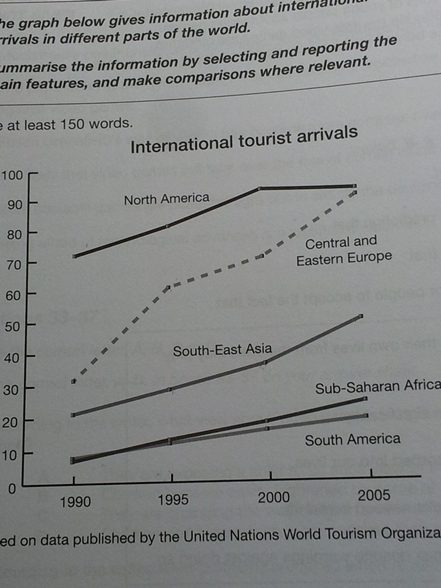
The graph represents the growth in the number of international tourists visiting five different regions over 5-year intervals from 1990 to 2005.
It can be seen from the graph that the numbers of oversea visitors to both Sub-Saharan Africa and South America climbed up slightly over the period of 15 years. In each region, visitors increased from a little below 10 million in 1990 to approximately 20 million in 2005.
In the meantime, South-East Asia also saw a steady increase in foreign tourists, particularly during 1990 and 2000. After that, the number began to rise a little to the point of almost 50 million in 2005.
Central and Eastern Europe however gained significant popularity among international holiday makers. The destination witnessed a 100 percent increase in tourists from 1990 to 1995 although this dramatic rise began to lessen from 1995.
In general, the numbers of visitors were on the increase in all regions, with the exception of the North American continent, where visitors grew constantly until the number started to drop from the year 2000 onwards.
| จากคุณ |
:
JM2p 
|
| เขียนเมื่อ |
:
16 ธ.ค. 55 20:55:52

|
|
|
|
|